I've recently become interested in d3.js, a library for data visualization. It's very nice to use, so I wanted to summarize what I've learned here with a little tutorial. I'll draw a map of the canton of Zurich colored by tax level. Here's what it looks like:
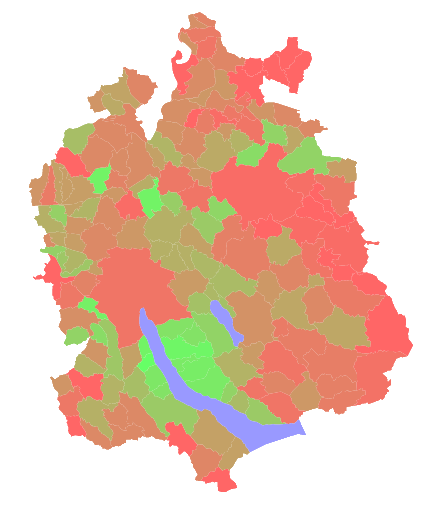
The entire HTML file to generate that is 59 lines. And the code is very simple, too.
Getting Data
The OpenData initiative has resulted in a lot of cool publicly available data in Switzerland. The portal for it is opendata.admin.ch, which is where I found this CSV file containing tax rates in the canton of Zurich from 1990 to 2014.
For drawing a map, d3.js supports GeoJSON, a relatively simple format for map geometry. But an extension of this called TopoJSON is even more popular, because it can re-use shared line-segments on borders and thus results in smaller files.
For this project, I need a map of the municipalities in the canton of Zurich. Apparently, map data is available from swisstopo for free, but I couldn't really figure out what data I need and how to get it in the right format. Instead I found this cool GitHub repository, which contains all sorts of maps for Switzerland, readily available in TopoJSON format. Here's how I got my map data:
sudo packer -S gdal # Or install gdal by whatever means
git clone https://github.com/interactivethings/swiss-maps.git
cd swiss-maps
make
make topo/zh-municipalities.json YEAR=2014
This provided me with a TopoJSON file in the topo/ directory containing the municipailities of Zurich. Cool! It's important to note that the year has to correspond to the year of our CSV data. Believe it or not, municipalities change all the time.
Setting up d3.js
Now that we have, we need a web server. The reason for this is that we want to load data from outside of the website, but for security reasons we can't just load file:// URLs from JS. If you have Python 3 installed, the simplest way to start a web server in the current directory is with the command
$ python -m http.server
Then you can access that directory under localhost:8000. Let's put our data in this directory: The generated "zh-municipalities.json" and our downloaded "Gemeindesteuerfuesse.csv". We also create an HTML file "index.html" which shall soon contain our code.
Now, let's fill that index.html with a basic JS playground structure. We're going to load two external JS libraries: d3.js and topojson to convert our TopoJSON into GeoJSON.
Here's the basic skeleton:
<!DOCTYPE html>
<html>
<head>
  <style>
    // our CSS style goes here
  </style>
</head>
<body>
  <script src="http://d3js.org/d3.v3.min.js"></script>
  <script src="http://d3js.org/topojson.v1.min.js"></script>
  <script>
    // our JS code goes here
  </script>
</body>
</html>
Try some JS code like
window.alert("hello");
and access localhost:8000 to see if everything works. It does? Onto the next step!
Drawing the map
Let's load the TopoJSON file first. d3.js has a very nice way to load and parse JSON files.
d3.json("zh-municipalities.json", main);
function main(error, topoJSON) {
  // code goes here
}
It's as simple as that.
The second step isn't quite as nice, it's time to convert it to GeoJSON to make it d3.js-compatible. For this, we use the following line:
var geoJSON = topojson.feature(topoJSON, topoJSON.objects.municipalities).features;
This gives us an array of objects, one for each municipality. Each object has a geometry array which encodes its coordinates. If you don't believe me, try it yourself and add
console.log(geoJSON);
below. Use the console ([Ctrl/Cmd]+Shift+I, then the Console tab in Chrome) to explore the objects.
The next step is to turn these coordinates into paths. Right now, it's not really defined what these coordinates mean. Are they like latitude and longitude - do we need to deal with projections and angles and all that stuff? Luckily no, to quote the map repository:
Per default, make will generate output files with the following characteristics:
- Projected, cartesian coordinates
- Scaled and simplified to a size of 960 × 500 pixels
This means that if you use D3.js, you must disable the projection
[...]
var path = d3.geo.path().projection(null);
Very nice. What does that path thing do? It's a path generator, a function that turns these GeoJSON objects into actual SVG shapes. So let's add that to our main function.
Next thing, we add a canvas to draw the map on. SVG inside HTML is cool because you can style the elements with CSS. Let's create a SVG tag, and style it with the 960×500 pixel size.
In CSS:
.map {
  width: 960px;
  height: 500px;
}
In JS:
var svg = d3.select("body")
  .append("svg")
    .attr("class", "map");
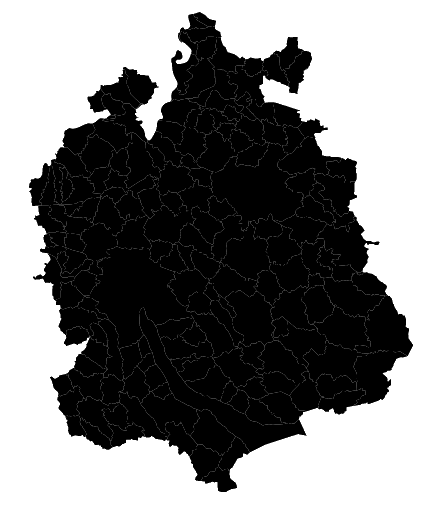
Now for the actual map drawing. As a quick overview, here's what we want to do: For each element e in the geoJSON array, we want to create a SVG
svg.selectAll("path")
  .data(geoJSON)
  .enter()
    .append("path")
      .attr("d", path);
So, what does this do? Well, first we select all "path" children elements from our SVG element. Those are currently none. The real magic happens in data(geoJSON) and enter(). data(x) compares the elements in the selection with the elements in x and creates three new selections: enter(), exit() and update. enter() contains all elements that are new to the data set, exit() contains all elements that were removed from the data set and update (the default without any further method call) contains all elements that are both in x and already exist as an HTML element.
Since we have an empty dataset before and our data is the geoJSON array, everything ends up in the enter() section. For each element e in geoJSON, we create a
Here is a link to the source code so far.
Coloring by data
For the next step, we would like to colour the municipalities by tax rate. This means that we're going to access two data sources at once, the TopoJSON file and the CSV containing the tax data. We can use d3.json and d3.csv to load both files separately, then call a function in both that checks whether both files have been loaded or just one, and if both, execute main. However, there's a much nicer implementation that scales to an arbitrary number of datasources: queue.js. queue.js is embedded just like the other JS files:
<script src="http://d3js.org/queue.v1.min.js"></script>
Now we replace the d3.json call at the beginning with this:
queue()
  .defer(d3.json, "zh-municipalities.json")
  .defer(d3.csv, "Gemeindesteuerfuesse.csv")
  .await(main);
This will automatically load the JSON and CSV files, parse them, and once done, call main with both the JSON and CSV data. Of course, we also have to modify the signature of our main method:
function main(error, topoJSON, taxCSV) {
  ...
Next up, we use this data to color the map. After the map is drawn, we extract the actually relevant data out of the CSV file. We only would like the column "STEUERFUSS_NATUERLICHE_PERS_1", where the column "JAHR" is 2014.
var taxes = taxCSV
  .filter(function(entry) { return entry.JAHR == 2014; })
  .map(function(entry) { return entry.STEUERFUSS_NATUERLICHE_PERS_1; });
This gives us an array of tax rates. To map those taxes to colors, we need to create a color scale from the lowest to the highest tax rate. Unfortunately, getting the minimum and the maximum of an array in JS is a bit of a pain. The nicest way is to add a min() and a max() function to the prototype of Array.
Array.prototype.max = function() {
  return Math.max.apply(null, this);
};
Array.prototype.min = function() {
  return Math.min.apply(null, this);
};
This way, we can figure out the minimum and maximum tax rate by calling taxes.min() and taxes.max().
Now we convert this into a linear color scale ranging from some green value for low taxes to some red value for high taxes. Here's how it's done in d3.js:
var color = d3.scale.linear()
  .domain([taxes.min(), taxes.max()])
  .range(["#6f6", "#f66"]);
Finally, we use again the data() call to update our map with this new data. We set the "fill" property of each path element inside the SVG depending on what color(tax) returns, where tax is an element in taxes:
svg.selectAll("path")
  .data(taxes)
  .attr("fill", color);
Reload, and done. Our map is colored. Woohoo!
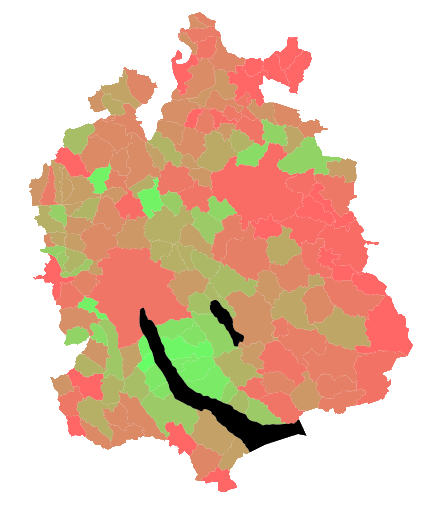
But wait, how does that magic data() call know which entry in the taxes list corresponds to which municipality? The answer is: It doesn't. It just happens to be the case that both lists, the GeoJSON and the CSV, are sorted by BFS ID, which is the unique ID for municipalities. Per default, d3.js just maps the nth data element in the array to the nth HTML element. If our list were not sorted, we'd either have to do that or supply a second argument to data() to sort out the mapping between data points and HTML elements. Finally, lakes have the highest IDs, so they ended up as the last elements. So it doesn't matter that they don't exist in the tax data. Lucky us! So how do we color the lakes blue? Remember how I talked about enter(), exit() and update selections? In this case, we update our data with tax data, and the lakes don't have any tax data. Therefore, they end up in the exit() section. And here's how we can modify our code to color them, too:
svg.selectAll("path")
  .data(taxes)
  .attr("fill", color)
  .exit()
    .attr("fill", "#99f");
Now we're really done!
Here's a link to the finished HTML file. Take a look at the source code to make sure I'm not cheating.
More
If you want to find out more about map drawing in d3, there's a nice tutorial called Let's Make a Map by Mike Bostock, king of visualizations and writer of d3.js. Confused by what those data() and enter() calls do? Take a look at Thinking with Joins by the same guy. Finally, there's always the d3.js API Reference for all the details.
I'm sure you can come up with many more interesting maps and visualizations. If you've made a cool one, shoot me an e-mail!